Smil takes examples upon examples - all fascinating and then part concludes: “... But historical perspectives demand skepticism. I stand by my conclusion that the two generations preceding WWI were the most exceptional innovative period in history and that its contributions have been far more consequential than the advances of the last two generations (Smil 2005). …”
Perhaps parts of innovation/progress has slowed
And thus has a whole book that broadly supports many of TS/BS ideas on innovation slowing down. Smil also has ( a depressing to me) conclusion of growth not decoupling from energy (carbon based) and materials and thus argues that (high) growth is not compatible with a low carbon world. I’m still re-reading this as I am not sure I agree with all this here (and neither does Bill Gates) - but both Gates and Smil are smarter and have read more here than me. I will come back to this - as it is one of the future challenges of where my show Thinking Bigly takes you.
I’m going to turn towards what is progress in the next section but leave the last word to Smil.
“...This might be perhaps the simplest single-paragraph summation of civilizational advances, a concise summary of growth that matters most. Our ability to provide a reliable, adequate food supply thanks to yields an order of magnitude higher than in early agricultures has been made possible by large energy subsidies and it has been accompanied by excessive waste. A near-tripling of average life expectancies has been achieved primarily by drastic reductions of infant mortality and by effective control of bacterial infections. Our fastest mass-travel speeds are now 50–150 times higher than walking. Per capita economic product in affluent countries is roughly 100 times larger than in antiquity, and useful energy deployed per capita is up to 200–250 times higher. Gains in destructive power have seen multiples of many (5–11) orders of magnitude. And, for an average human, there has been essentially an infinitely large multiple in access to stored information, while the store of information civilization-wide will soon be a trillion times larger than it was two millennia ago. And this is the most worrisome obverse of these advances: they have been accompanied by a multitude of assaults on the biosphere. Foremost among them has been the scale of the human claim on plants, including a significant reduction of the peak post-glacial area of natural forests (on the order of 20%), mostly due to deforestation in temperate and tropical regions; a concurrent expansion of cropland to cover about 11% of continental surfaces; and an annual harvest of close to 20% of the biosphere’s primary productivity (Smil 2013a).”
What is progress?
There are broadly three categories here I’d like to touch upon raised by TC/BS.
A general invention that enables many more inventions, but it itself might not seem that valuable. Perhaps, you would put paper into this category or - as I will come to healthcare later - the idea of random controlled trials, which has enabled us to judge if healthcare interventions (eg surgery) actually work or not.
Social progress or not directly economic progress, matters such as equality, minority rights; peace - perhaps eudomonia - long-term happiness. Matters that might be captured under ideas of “human assets/capital/progress” - literacy rates, education and the like.
Biodiversity and natural capital and related assets/liabilities - maybe light pollution, noise pollution would fall here.
There are many economists/commentators outlining the deficits in GDP (see blog on Smil on this again) and many of these factors (not always natural capital) are outside of GDP - although seemingly correlate with GDP.
I have 3 speculations - sadly I don’t really have primary data to back them up, so I leave it in the sphere for others to take away:
-Inclusion of social progress factors, such as literacy, life expectancy, equality, maybe peace would indicate that progress is still doing well in some aspects (see WorldIInData for some of this)
-Inclusion of biodiversity and natural capital would suggest we are doing much worse - as we’ve turned eg trees into economic or social capital - food, houses, life expectancy.
-But, possible focus on certain system wide innovations may still grant us another jump up in certain aspects of progress eg healthcare.
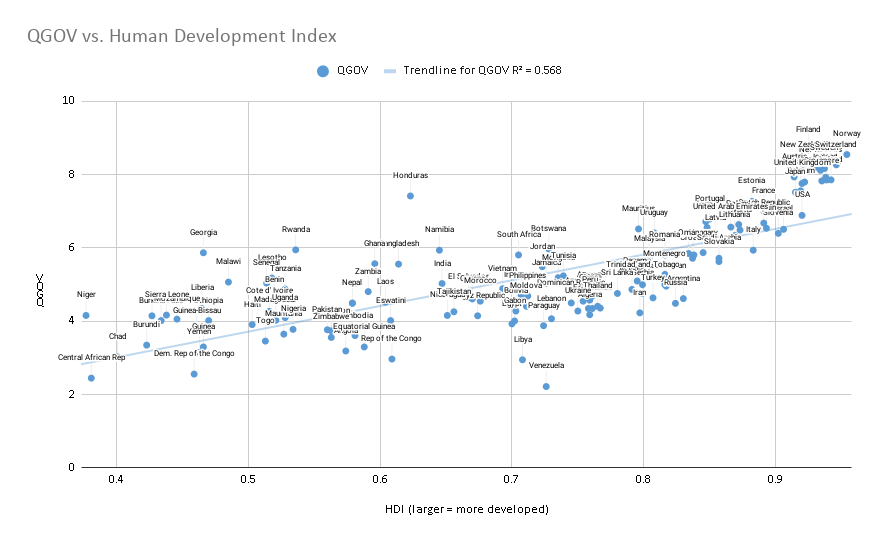
There are indices looking at human development (eg human development index, worldindata) or peace (peace index)
I don’t exactly know how to put literacy rates and access to the internet into the progress bucket, but putting them together gives people who have these two items/skills access to a great deal of the sum of human knowledge and fairly good access to a good amount of human culture within music and visual arts.
I think you would have to put that into the positive ledger of progress even though exactly what it means is harder to measure.
I would say the same for peace and for equal rights to women and minorities. There is an economic dividend but there is a sizeable social/human progress gain as well - in my reading.
We still have a way to go and there are diminishing gains as around 9/10 of the world is now literate and 6/10 have access to the internet - which might argue for this progress slow down. Still, it’s significant.
I’m unsure how you add it all together but a wide business framework has suggested (using capital as a metaphor):
According to the IIRC - “Together they represent stores of value that are the basis of an organization's value creation.”
I think that framework could be applied to many aspects of progress in its wider sense. I would note New Zealand has some thinking along these lines at a country level.
There are trade-offs here. Social cohesion may increase elements of social capital, but it may lower some other progress capitals eg diversity and number of new ideas - intellectual capital - as there is less creative conflict (only theoretical speculation here).
The biggest trade-off is with natural capital. Turning trees into buildings, clearing forest to plant palm oil these typical increase financial and other human capital but there are many long term consequences which may be felt here. Perhaps these could be put together and considered “Progress Capitals” and so when we think about studying progress we could think about studying these Progress Capitals.
One way to look at natural capitals would be to attempt to discount the costs of the IPCC scenarios of a 3 deg scenario or the biodiversity loss scenario - translating it back to GDP costs suggest progress might not be doing so well and will also hamper other parts of what I’m suggesting as progress capitals as a metaphor.
As an aside, here it’s interesting to note ideas of how much to discount future generations cf. TC’s Stubborn Attachments or other “common sense” utilitarian morality concepts.
This leads me to my third speculation on certain system innovations particularly looking at healthcare.
Thinking about narrow inventions/progress vs systems progress in Healthcare
There are these class of inventions or ideas which by themselves don’t immediately lead to progress or profit but which enable a whole other set of ideas and inventions.
In modern healthcare, I think the idea controlled trials have been one of those enabling ideas. (Short of History of it here https://www.ncbi.nlm.nih.gov/pmc/articles/PMC3149409/ by Arun Bhutt (2010) While we have some fleeting ideas of this in ancient history (eg King Nebuchadnezzar of Babylon) it was James Lind in 1747 testing lemons and oranges if they impacted scurvy for sailors who probably founded the idea of controlled trials. These random controlled trials (RCT) have been a driving idea behind some of Duflo and Banerjeee work in economics (recent Nobel winners) - so the innovation has spread wider than healthcare.
This started much future pharmaceutical drug development. These modern drugs we can now value both in terms of lives saved (eg antibiotics) and thus their direct progress effects - which last for decades/centuries after invention, and their economic sales.
In some areas we may undervalue this value. Modern aspirin was invented around 1897. Morphine was marketed from even earlier. What’s the value of less pain in the last 200 years? All those headaches and the productivity potentially associated with it? And while opiods have created their own crisis, the flip side is that we can die painless (look at morphine). We can’t really ask, but I suspect there is a lot of value in being able to be pain free in your last week of life. Although from I tell the survey data around pain is mixed, we do know happiness (at least in the moment, and maybe for others memories) is impacted by the ending. To know ones you love didn’t die in pain and that you may not die in pain. Is that progress? I think so. Hard to measure. (Aside, would giving animals a good life and a pain free death also be a large mark of progress in a fully considered world, I think so.)
In any case, continuing with the drug development example - we are now developing for ever more narrow diseases. Rare, genetic diseases and the like. These help thousands of people rather than billions. There might be spillover inventions from gene therapy and gene editing, and there’s going to be progress. But if you think about broad based human health (via life expectancy) as the sign of progress it’s going to be more limited - these cures for rare diseases won’t impact broad life expectancy, compared to working for instance on obesity or indeed, on working on drug/protocol compliance for blood pressure.
This appears to me to a potential market failure. The economic and social progress returns to solving for obesity would seem to me to be high but actual capital (of all forms) directed at obesity seems sub-optimal. (I’ve made a similar argument for the amount of innovation directed at climate change challenges although that’s arguably more complex due to externalities and conflicting trade-offs).
Take a thought experiment. 36% of the US are obese (CDC estimates), these have direct (medical) and indirect (productivity) costs as well as impact life expectancy. Range of costs super wide but eg this review (https://www.ncbi.nlm.nih.gov/pmc/articles/PMC5409636/) cites EUR60bn (approx 50/50 split direct/indirect) to Germany.
Now take a relatively low cost speculative intervention such as intermittent fasting [IF] (before even going into ideas of meditarean diets or other social / life style changes). There are relatively few studies on IF even though there is initial evidence that it may help obesity, pre-diabetes/diabetes and via metabolic effects I’ve spoken to researchers who believe it may impact dementia and alzheimer’s and several reviews available (eg for lay person here: https://www.nature.com/articles/d41586-018-05724-7) so one intervention that could impact at low cost some of the highest burden problems of America (dementia, obesity, diabetes etc.) is only having moderate capital and effort put behind it. (As an aside, the current CEO of Novartis, Vas, is an IF practitioner and he is a doctor, ex-Mckinsey type.)
There’s no easy money to make for private companies in IF. The concept of only eating between 12 and 8pm, say, is not easily monetisable even if it would produce potentially quite an increase in progress.
I have no solution for this although perhaps that’s one area government-private led eg DARPA / ARPA-E type organisations could excel. And overall systems solutions often have both social determinants, as well as structural and financial determinants (eg US healthcare vs Singapore healthcare systems).
Still - going back to the question of progress - I’d speculate that one reason for some slowdown might be due to our collective inability to examine and innovate successfully on some of these systems problems eg obesity, climate - and the human culture/capital type challenges.
Summary
(repeat) Putting this back together - we don’t have a robust framework for “what is progress” and our current framework may too narrowly emphasise GDP type financials over peace, social, human, natural, ideas, innovation type progress capitals. While GDP seems to correlate with other indices of these progress capitals eg peace, happiness I speculate it is still not capturing major elements of progress. I suggest some frameworks of other progress capitals may be helpful.
General ideas (general purpose inventions) can provide wide enablement, but it seems our innovations are increasingly narrow. In the long history of growth provided by Smil, this is unsurprising and there is evidence that innovation 2 generations ago was a greater step change. But, I contend that there remain some system wide innovations which are ripe for taking - such as obesity - which are potential market failures and others such as human capital and culture which could bring great progress still but are unclear on prescriptions. So a science of science or a science of progress seems important and intriguing to me and I hope some very smart people to decide to work on it.
Links:
Cowen / Southwood paper.
Collinson / Cowen in the Atlantic -
Collinson / Cowen talking to Mark Zuckerberg
The Vaclav Smil book on Growth
My £10K microgrants programme.